Role:
Sole designer & engineer
Stack:
Go, PostgreSQL, VictoriaMetrics, embedded Tabler UI
Status:
In production, self-hosted, private source
Panopticon
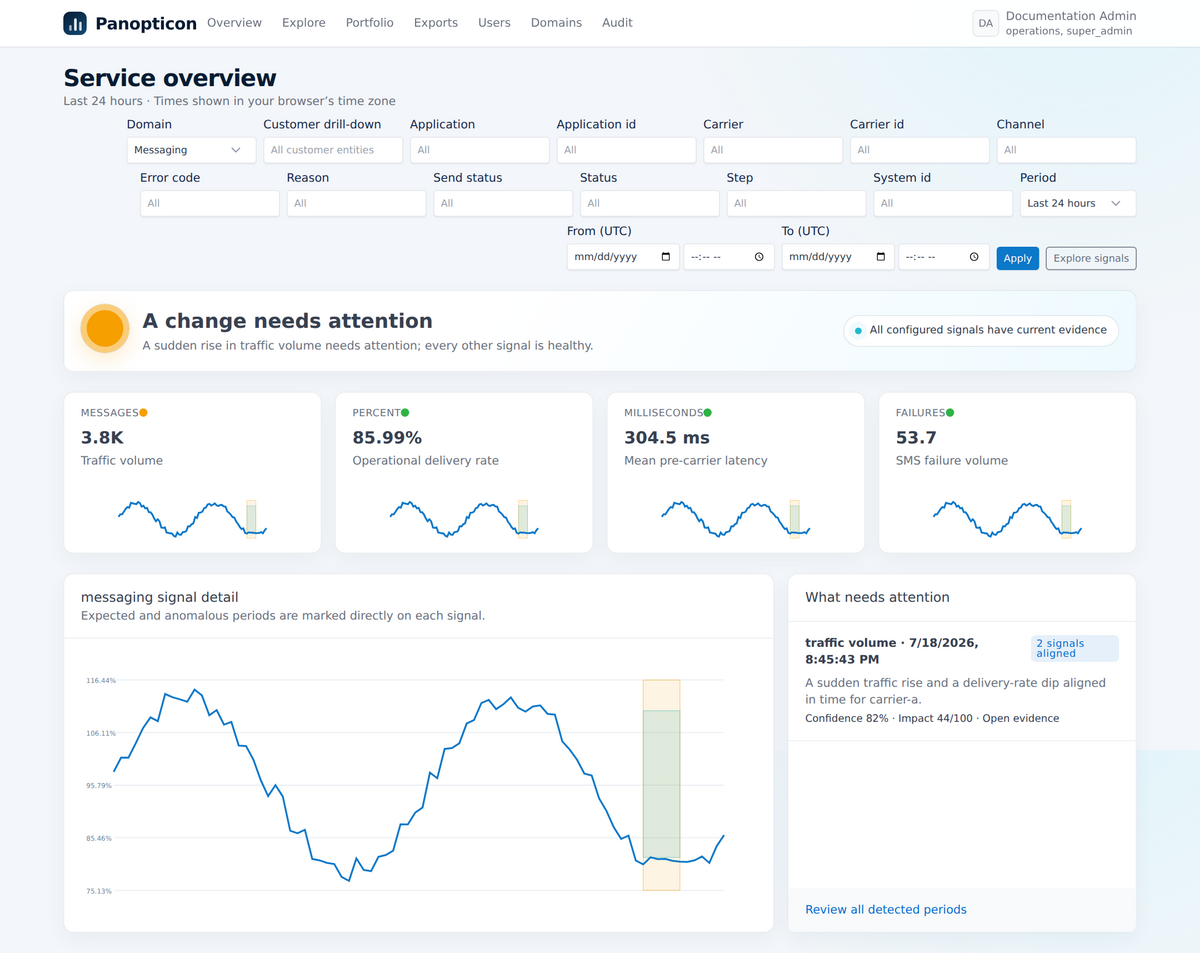
Customer-facing observability as a proper product rather than a Grafana skin. Panopticon turns a metrics store into typed signals, runs fourteen deterministic detectors over every one of them, correlates what lines up, and shows each customer their own traffic, rates and latency with a plain-English explanation, a confidence score and an exact time window behind every anomaly. A graph is not an answer. Evidence is.
- Observability
- Anomaly detection
- Go
- Multi-tenant
- Security engineering
The itch
Every observability stack I have run ends up in the same place: a wall of Grafana dashboards that engineers can read and nobody else can. Customers ask "was that you or us?" and the honest answer takes an hour of squinting at panels. Account managers want to show a client the story of an incident without handing them a Grafana login and a tour. And the detection layer is a pile of alert rules that fire on thresholds someone guessed at in 2021.
I wanted the thing that sits on top of the metrics and does the explaining: which signal moved, when it started, when it resolved, how confident we are, what else moved at the same time, and all of it in words a customer can read. Then I wanted every part of that to be configuration, so the next service could be described in a YAML file rather than a fork of the code.
What I built
One Go binary, about 21,000 lines across sixteen internal packages, with every template, stylesheet, script, vendored UI asset, SQL migration, JSON Schema and built-in domain definition embedded in it. No Node, no npm, no CDN, no separate asset server. PostgreSQL holds identity, sessions, grants, domain versions, jobs and the audit log; VictoriaMetrics holds metric history and nothing else.
A domain is a typed document: the tenancy label, the metric contracts, the signals, the detector policies, the relationships between signals and the composed dashboard pages. Messaging is the first published domain. An Energy example proves the point, because it exercises tenancy, metric algebra, detectors, correlation and views without a line of domain-specific Go. Administrators draft a domain in a workbench with a guided designer and a metric wizard, validate it against the schema, preview signals live, backtest policies against real history, then publish an immutable version. Customer access is a separate audited step after the tenancy review.
Fourteen detector families run over every configured signal: threshold, rolling baseline, sustained degradation, lag comparison, seasonal, rate of change, volatility burst, flapping, stuck metric, missing data, cross-series outlier, regression baseline, binomial regression baseline and comparison against a hidden reference. Rates keep their numerators and trials, weighted means keep their observation counts, and immature cohorts are excluded so a 72-hour delivery window does not look like an outage every afternoon. Findings that line up across signals are joined transitively into detected periods with a ranked headline, and the language is careful never to claim causality. A hidden reference signal can mark a finding as a wider issue without ever being charted.
On top of that sits the interface: four-state health, annotated graphs with clickable incident bands, an evidence dialog that charts the signal and its related sub-metrics either side of the incident, an optional war board that lists every detected period across an estate, per-signal threshold zones, custom time ranges, audited formula-safe CSV export, and an opt-in alerting subsystem with webhook, email, Telegram, Slack and PagerDuty delivery. An optional LLM layer can draft the explanation for a war-board row, bounded by the deterministic evidence and cached, and if the provider fails the deterministic wording stays.
Engineering decisions
- The browser never sends a query: it sends catalogue identifiers, filter values, groupings and a time range. Every MetricsQL expression is compiled server-side with a mandatory injected tenancy matcher, escaped values, whitelisted filters and bounded range, series, point and export cost. Labels returned by the metrics store are display data and never grant access.
- Administrative capability is not data access: a super-administrator can create users and publish domains but cannot read a single customer metric without an explicitly granted entity scope. Creating a user grants no domains at all.
- Grants are typed constraint policies: an OR of AND-sets over safe labels, compiled into separate escaped scopes and unioned, so a person restricted to two carriers on one account can never widen that into the Cartesian product. A browser filter can narrow a set or be refused, never replace it.
- Domains are configuration, not code: if a behaviour belongs to one service, it belongs in the definition. That rule is what makes the second domain cheap and the tenth free.
- Reproducible analysis: historical analyses and exports are database-leased jobs that record domain, policy and engine versions, survive a restart, and revalidate the requester's current access before results are shown or downloaded.
- Tenant isolation is release-blocking: the security notes list every control, from Argon2id and opaque hashed sessions to CSP, SSRF guards on outbound webhooks and formula neutralisation in CSV, and the repo carries dated security audits with their remediation records.
What it demonstrates
Turning years of running Prometheus, Grafana and VictoriaMetrics for a messaging platform into a product that other people can operate: statistics that are honest about confidence, a query planner that treats tenancy as a hard boundary, and an interface that a customer, an account manager and an on-call engineer can all read from the same evidence. It is the observability work I describe elsewhere on this site, shipped as one binary with a threat model instead of a folder of dashboards.